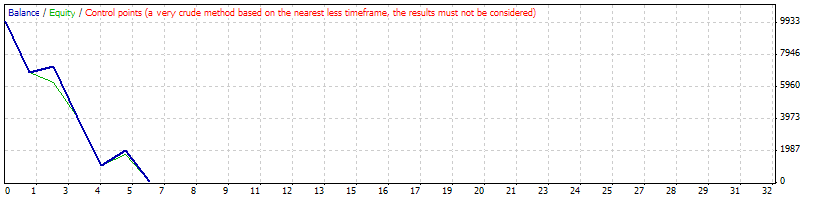
Strategy Tester Report
[ea]DailyHiLoFIB_Ron_MT4_v01b
AlpariUK-Demo (Build 225)
| Symbol | USDCAD (US Dollar vs Canadian Dollar) | ||||
| Period | 1 Hour (H1) 2009.01.05 17:00 - 2009.12.31 18:00 (2009.01.01 - 2010.01.01) | ||||
| Model | Control points (a very crude method, the results must not be considered) | ||||
| Parameters | ATRPeriod=0; ATRMultiplier=1; MartingaleStyle=0; Lots=5; StartingBalance=0; ProfitMade=0; BasketProfit=0; LossLimit=69; BasketLoss=0; BreakEven=0; TrailStop=34; LotResolution=1; KillLogging=false; | ||||
| Bars in test | 6211 | Ticks modelled | 152607 | Modelling quality | n/a |
| Mismatched charts errors | 70 | ||||
| Initial deposit | 10000.00 | ||||
| Total net profit | -9881.27 | Gross profit | 1300.34 | Gross loss | -11181.61 |
| Profit factor | 0.12 | Expected payoff | -1646.88 | ||
| Absolute drawdown | 9881.27 | Maximal drawdown | 9906.54 (98.82%) | Relative drawdown | 98.82% (9906.54) |
| Total trades | 6 | Short positions (won %) | 4 (25.00%) | Long positions (won %) | 2 (50.00%) |
| Profit trades (% of total) | 2 (33.33%) | Loss trades (% of total) | 4 (66.67%) | ||
| Largest | profit trade | 929.15 | loss trade | -3183.44 | |
| Average | profit trade | 650.17 | loss trade | -2795.40 | |
| Maximum | consecutive wins (profit in money) | 1 (929.15) | consecutive losses (loss in money) | 2 (-6173.70) | |
| Maximal | consecutive profit (count of wins) | 929.15 (1) | consecutive loss (count of losses) | -6173.70 (2) | |
| Average | consecutive wins | 1 | consecutive losses | 1 | |
| # | Time | Type | Order | Size | Price | S / L | T / P | Profit | Balance |
| 1 | 2009.01.05 17:00 | sell | 1 | 5.00 | 1.18720 | 0.00000 | 0.00000 | ||
| 2 | 2009.01.05 17:00 | modify | 1 | 5.00 | 1.18720 | 1.20410 | 0.00000 | ||
| 3 | 2009.01.05 17:50 | close | 1 | 5.00 | 1.19464 | 1.20410 | 0.00000 | -3113.91 | 6886.09 |
| 4 | 2009.01.05 18:00 | buy | 2 | 5.00 | 1.19224 | 0.00000 | 0.00000 | ||
| 5 | 2009.01.05 18:00 | modify | 2 | 5.00 | 1.19224 | 1.17534 | 0.00000 | ||
| 6 | 2009.01.06 06:10 | modify | 2 | 5.00 | 1.19224 | 1.19247 | 0.00000 | ||
| 7 | 2009.01.06 06:16 | modify | 2 | 5.00 | 1.19224 | 1.19313 | 0.00000 | ||
| 8 | 2009.01.06 08:02 | s/l | 2 | 5.00 | 1.19313 | 1.19313 | 0.00000 | 371.19 | 7257.28 |
| 9 | 2009.01.06 08:02 | sell | 3 | 5.00 | 1.19076 | 0.00000 | 0.00000 | ||
| 10 | 2009.01.06 08:02 | modify | 3 | 5.00 | 1.19076 | 1.20766 | 0.00000 | ||
| 11 | 2009.01.06 08:50 | close | 3 | 5.00 | 1.19839 | 1.20766 | 0.00000 | -3183.44 | 4073.84 |
| 12 | 2009.01.06 08:52 | buy | 4 | 5.00 | 1.19765 | 0.00000 | 0.00000 | ||
| 13 | 2009.01.06 08:52 | modify | 4 | 5.00 | 1.19765 | 1.18075 | 0.00000 | ||
| 14 | 2009.01.06 10:45 | close | 4 | 5.00 | 1.19053 | 1.18075 | 0.00000 | -2990.26 | 1083.58 |
| 15 | 2009.01.06 10:47 | sell | 5 | 5.00 | 1.19093 | 0.00000 | 0.00000 | ||
| 16 | 2009.01.06 10:47 | modify | 5 | 5.00 | 1.19093 | 1.20783 | 0.00000 | ||
| 17 | 2009.01.06 11:15 | modify | 5 | 5.00 | 1.19093 | 1.19062 | 0.00000 | ||
| 18 | 2009.01.06 11:20 | modify | 5 | 5.00 | 1.19093 | 1.18872 | 0.00000 | ||
| 19 | 2009.01.06 11:40 | s/l | 5 | 5.00 | 1.18872 | 1.18872 | 0.00000 | 929.15 | 2012.73 |
| 20 | 2009.01.06 11:40 | sell | 6 | 5.00 | 1.18872 | 0.00000 | 0.00000 | ||
| 21 | 2009.01.06 11:40 | modify | 6 | 5.00 | 1.18872 | 1.20562 | 0.00000 | ||
| 22 | 2009.01.06 11:50 | close at stop | 6 | 5.00 | 1.19324 | 1.20562 | 0.00000 | -1894.00 | 118.73 |